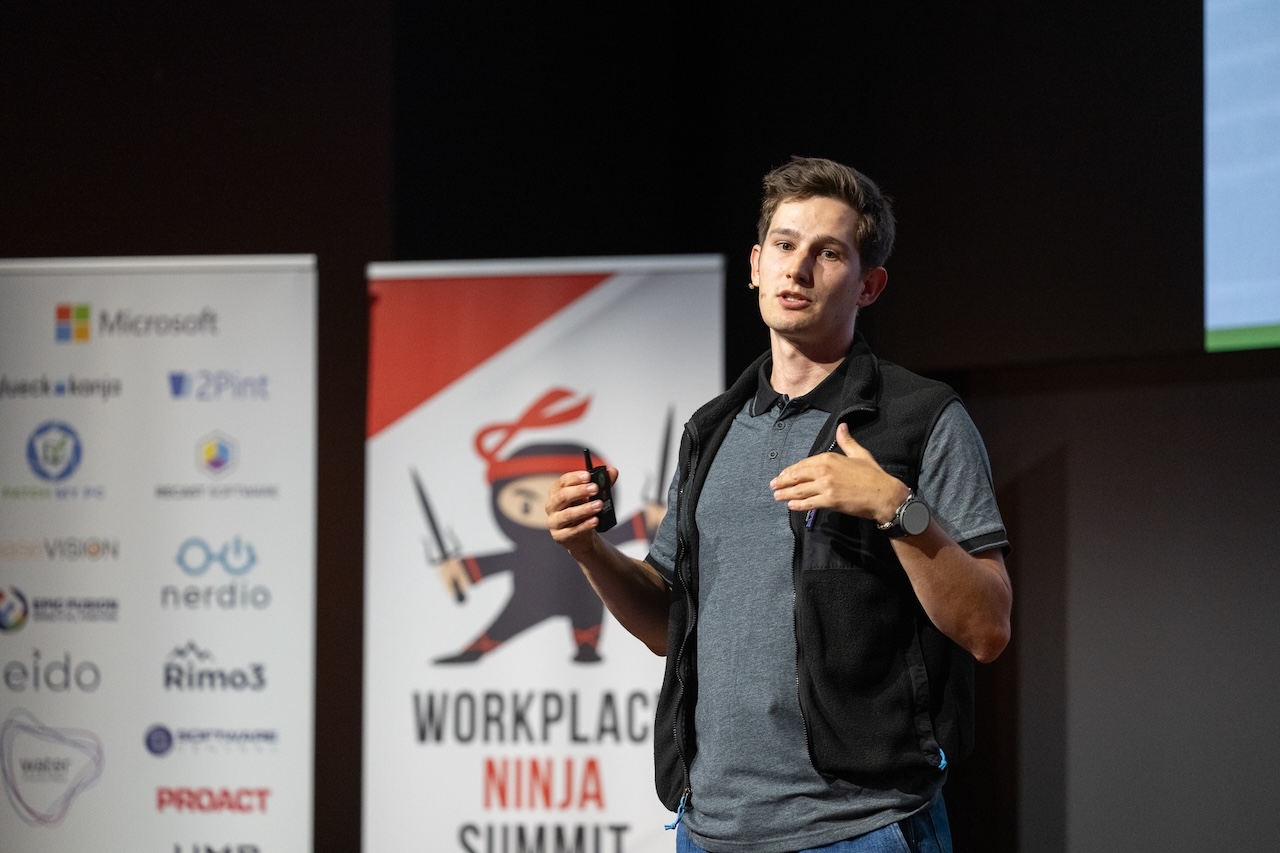
Passionate about cyber security, I build today’s defenses with Microsoft Security for tomorrow’s threats. As a security consultant, I share what I learn here through posts, my Today I Learned series, and occasionally on stage at conferences.
Dangling DNS records and OIDC redirect URIs are well-known, actively exploited security misconfigurations. While federated identity credentials reduce the risks of token exposure and leaked secrets, they can leave dangling trust relationships too.
Federated credentials are usually tied to two important token claims: iss (issuer) and sub (subject). For federated credentials in GitHub Actions pipelines, the GitHub IdP issues tokens with the following claims (truncated):
{ "payload": { "aud": "api://AzureADTokenExchange", "iss": "https://token.actions.githubusercontent.com", "ref": "refs/heads/main", "repository": "nicolonsky/ITDR", "repository_id": "715070358", "repository_owner": "nicolonsky", "repository_owner_id": "32899754", "sub": "repo:nicolonsky/ITDR:ref:refs/heads/main" } } Regardless of whether your repository belongs to an individual or an organization, the owner and repository names are constructed from your username or organization name.
Get a GitHub Action OIDC token In a JavaScript GitHub Action, @actions/core provides getIDToken to request a JWT from GitHub’s OIDC provider. You can then acquire a token with const token = await core.getIDToken(audience);.
If you’ve been in the Defender XDR portal, you might have noticed some new badges and banners hinting that Microsoft Defender now comes with native case management:
The feature was also part of the ISOC announcement and is now rolling out in public preview to Defender customers. Microsoft also published a message center post:
Microsoft Defender is introducing native Case Management to help security teams investigate and resolve threats faster while reducing tool sprawl. MC1477993
Sometimes SOC teams handle incidents in Defender but track the actual work, such as ownership, tasks, SLAs and handover notes, in separate tools. These can be ticketing systems or sometimes even Jira, while other teams use dedicated SOAR solutions. Many of those also have a sunset date, like Palo Alto XSOAR in 2029 1. So Microsoft keeps up the pace and adds incident management capabilities under the name of cases. Cases aim to bring work back from external tools directly into the Defender portal.
Case types # Case management currently supports two case types:
Incident cases (preview): Created by the service from correlated incident activity. During this phase, each incident case maps one-to-one to an incident.2 Generic cases: Created manually to track SecOps work outside the incident workflow, for example, a threat hunt, a hardening follow-up or an audit request. Microsoft recommends incident cases as the new experience for managing incidents. The legacy incident experience remains available during the preview.3
AI decision models are the new kids on the block, with TypeSafe AI’s Jev,1 Cloudflare’s Clef,2 and Microsoft-Decision-1.3 Frontier models are powerful for complex analysis and generating text, but automation often needs smaller answers: which category, which queue, or whether to escalate. Decision models focus on these bounded tasks, returning structured choices and probabilities without generating free-form text. This can reduce latency and cost while giving AI-based workflows outputs they can act on directly. Probability thresholds can then determine whether to proceed, request another evaluation, or hand the decision to a human in the loop.
In short:
An AI decision model reads an input and returns an answer from a set you define (an option, a score, or the probability that something is true), with a calibrated probability for every allowed answer, in one pass and without generating text. - System One Models4
So I was curious to test the Microsoft-Decision-1 model and better understand how it works in an experiment related to SecOps and incident automation.
My Experiment # When alert volumes are high, SOC teams tend to prioritize medium- and high-severity alerts and use automation to triage or close lower-severity alerts. I tested whether Microsoft-Decision-1 could identify alerts worth escalating or recommend a lower severity based on the alert and included alert evidence. These outcomes could support incident reviews by highlighting alerts that are worth another look or support detection engineering to adjust a detection’s severity level.
Gartner describes ISOC (Integrated Security Operations Center) as a converged technology approach that combines threat detection, investigation, and response (TDIR) in a single-vendor suite or cloud service.1 For Microsoft, that means Defender XDR and Microsoft Sentinel. This shift started a while ago with the move towards the unified security operations platform (USOP).
With ISOC, Microsoft 365 E5/E7 customers without Sentinel can now use features previously available only to customers using both Defender XDR and Microsoft Sentinel.
This post covers the ISOC in Microsoft Defender preview. Capabilities and availability may change during the preview. See the official ISOC in Microsoft Defender documentation and Microsoft’s announcement. Why Microsoft is doing this # You could already be a Sentinel customer without paying for the SIEM features: Sentinel lets you ingest some first-party Microsoft data, mainly alerts, as part of free data sources.
In my view, Microsoft is following the industry’s direction while also helping shape it. ISOC is now its own category in Gartner’s 2026 Hype Cycle for Security Operations, alongside security data lakes.2 Both are newer alternatives to a classic SIEM.
When speaking with customers and colleagues, I often encounter questions and misconceptions about Defender for Servers in Microsoft Defender for Cloud. In this post, I explore these questions:
Why should I care about Defender for Servers? How should I onboard my servers to Microsoft Defender for Servers? What happens under the hood when I onboard servers? How can I selectively deploy Defender for Servers (e.g., for a pilot)? How can I enforce and maintain full coverage of Defender for Servers? How can I monitor and query Defender for Servers coverage? Typical confusion of Defender for Servers Defender for Servers Plans and Licensing # While client devices in Microsoft Defender for Endpoint (MDE) are usually licensed through Microsoft 365 subscriptions such as Microsoft 365 E5, servers do not benefit from this licensing model. Instead, server licensing follows the Azure consumption model.
If you work with the Microsoft account team, you might also be able to obtain Microsoft Defender for Endpoint Server licenses. These are not consumption-based, so they do not require an Azure subscription and are usually part of enterprise agreements.